26.03.2011
РОССИЙСКАЯ АКАДЕМИЯ НАУК

УРАЛЬСКОЕ ОТДЕЛЕНИЕ

ИНСТИТУТ ХИМИИ TBEPДОГО ТЕЛА
   
| | | | |
| | | | | |
 26.03.2011   Карта сайта     Language По-русски По-английски
Новые материалы
Экология
Электротехника и обработка материалов
Медицина
Статистика публикаций


26.03.2011


Recent advances in submolecular resolution with scanning probe microscopy


Journal name:

Nature Chemistry

Volume:

3,

Pages:

273–278

Year published:

(2011)

DOI:

doi:10.1038/nchem.1008


Published online


Abstract


Recently scanning probe microscopy has made tremendous progress in imaging organic molecules with high lateral resolution. Atoms and bonds within individual molecules have been clearly resolved, indicating the exciting potential of this technique for studying molecular structures, bonding within and between molecules, molecular conformational changes and chemical reactions at the single-molecule level. It turns out that the key step enabling such studies is an atomically controlled functionalization of the microscope tip. In this Perspective, the different techniques used for high-resolution molecular imaging, their implementations, advantages and limitations are described, and possible scientific areas of applications are discussed.


left


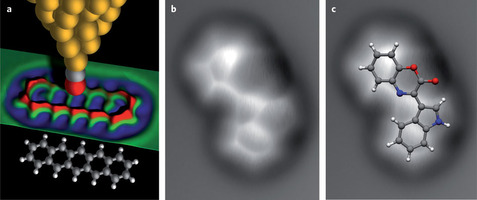
  1. Figure 1: Molecules imaged with atomic resolution using NC-AFM.


    Constant-height NC-AFM measurements using CO-functionalized tips. a, Model of a CO-functionalized tip above a pentacene molecule. The measured AFM data is shown as a colour-coded map (Δf = −7 Hz (blue) to −2 Hz (red); oscillation amplitude A = 0.02 nm; measurement data taken from ref. 1). b, Cephalandole A. Image size 1.6 nm × 1.9 nm; A = 0.05 nm; grey scale from −7 Hz (dark) to +2 Hz (bright). c, The same image as (b) with the molecular model of cephalandole A overlaid. Images b and c reprinted with permission from ref. 2, © NPG 2010).


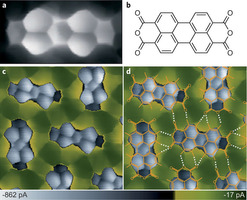
  2. Figure 2: PTCDA monolayer imaged with STHM.


    a, STHM image of PTCDA on Au(111). Image size 1.3 nm × 0.7 nm; constant height, V = 5 mV. b, Chemical structure of PTCDA. c, STHM image of the herringbone phase of PTCDA on Au(111). Image size 2.5 nm × 2.5 nm; constant height, V = −2 mV. d, The same image with the molecular structures and possible hydrogen bonds indicated. Reprinted with permission from: a, b, ref. 4, © 2010 APS; c, d, ref. 5, © 2010 ACS.


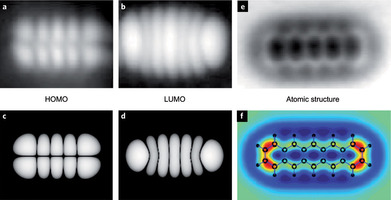
  3. Figure 3: Pentacene imaged with STM and NC-AFM.


    a,b, Molecular orbital images of pentacene on two monolayer NaCl on Cu(111) obtained by STM using a pentacene-terminated tip. Image size 2.5 nm × 2.0 nm; constant current. The HOMO (a) was imaged by setting the sample voltage to the first resonance at negative bias at V = −2.5 V, thus tunnelling out of the molecular orbital. The LUMO (b) is imaged by electrons tunnelling from the tip into the orbital at positive bias V = +1.7 V. c,d, Contours of constant orbital probability distribution of the HOMO (c) and LUMO (d) of the free pentacene molecule obtained by DFT. e, NC-AFM image of pentacene on two monolayer NaCl on Cu(111) obtained using a CO-functionalized tip. Image size 2.2 nm × 1.4 nm; oscillation amplitude A = 0.07 nm. f, Computed frequency shift for an intermolecular distance d = 0.475 nm between CO and pentacene. Reprinted with permission from: a–d, ref. 9, © 2005 APS; e, ref. 1, © 2009 AAAS; f, ref. 34, © 2010 IOP.


  4. Figure 4: Measuring reaction rates with submolecular resolution.


    Spatial map of the switching rate for the hydrogen tautomerization reaction (shown in the insets below). The reaction rate is measured using STM time traces at each pixel for a tunnelling current of 1 pA at a bias of 1.825 V. For reference, the structure of the molecule is displayed to scale. Reprinted with permission from ref. 11, © 2007 AAAS.


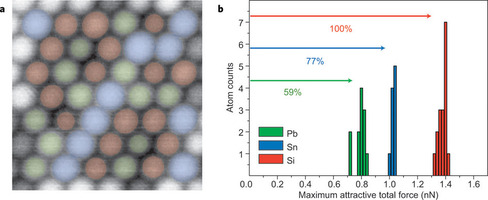
  5. Figure 5: NC-AFM with chemical sensitivity.


    a, NC-AFM image of a surface alloy composed of Si, Sn and Pb atoms blended in equal proportions on a Si(111) substrate. The colour coding corresponds to the chemical species as determined by force distance spectroscopy: Si, red; Pb, green; Sn, blue. b, Atom counts as a function of the maximum measured attractive force above the Pb, Sn and Si atoms. The three different atom species are clearly distinguished by their respective maximum forces. Reprinted with permission from ref. 14, © 2007 NPG.


Дизайн и программирование N-Studio 
А Б В Г Д Е Ё Ж З И Й К Л М Н О П Р С Т У Ф Х Ц Ч Ш Щ Ъ Ы Ь Э Ю Я
  • Chen Wev   honorary member of ISSC science council

  • Harton Vladislav Vadim  honorary member of ISSC science council

  • Lichtenstain Alexandr Iosif  honorary member of ISSC science council

  • Novikov Dimirtii Leonid  honorary member of ISSC science council

  • Yakushev Mikhail Vasilii  honorary member of ISSC science council

  • © 2004-2024 ИХТТ УрО РАН
    беременность, мода, красота, здоровье, диеты, женский журнал, здоровье детей, здоровье ребенка, красота и здоровье, жизнь и здоровье, секреты красоты, воспитание ребенка рождение ребенка,пол ребенка,воспитание ребенка,ребенок дошкольного возраста, дети дошкольного возраста,грудной ребенок,обучение ребенка,родить ребенка,загадки для детей,здоровье ребенка,зачатие ребенка,второй ребенок,определение пола ребенка,будущий ребенок медицина, клиники и больницы, болезни, врач, лечение, доктор, наркология, спид, вич, алкоголизм православные знакомства, православный сайт творчeства, православные рассказы, плохие мысли, православные психологи рождение ребенка,пол ребенка,воспитание ребенка,ребенок дошкольного возраста, дети дошкольного возраста,грудной ребенок,обучение ребенка,родить ребенка,загадки для детей,здоровье ребенка,зачатие ребенка,второй ребенок,определение пола ребенка,будущий ребенок